Monitoring Overview
Running a stake pool means being on-call for a live system. A node that silently falls behind the chain, misses its slot, or has expiring KES keys will cost you and your delegators rewards. Good monitoring catches these problems before they become expensive.
What to monitor
| Metric | Why it matters |
|---|---|
| Sync progress / slot height | A node that has fallen behind will not mint blocks |
| Block production | Are you winning and minting your assigned slots? |
| KES key expiry | Node stops forging when KES expires (~90 days on mainnet) |
| Memory and CPU | Sustained high usage is often a warning sign |
| Disk space | The chain database grows continuously — running out kills the node |
| Process liveness | Is the node process actually running? |
| Peer connections | Too few hot peers degrades block propagation |
| Block propagation | Blocks must reach a large portion of the network in a timely manner |
| Unexpected errors | It is impossible to anticipate every possible error. But keep an eye out for an unusually high number of errors. |
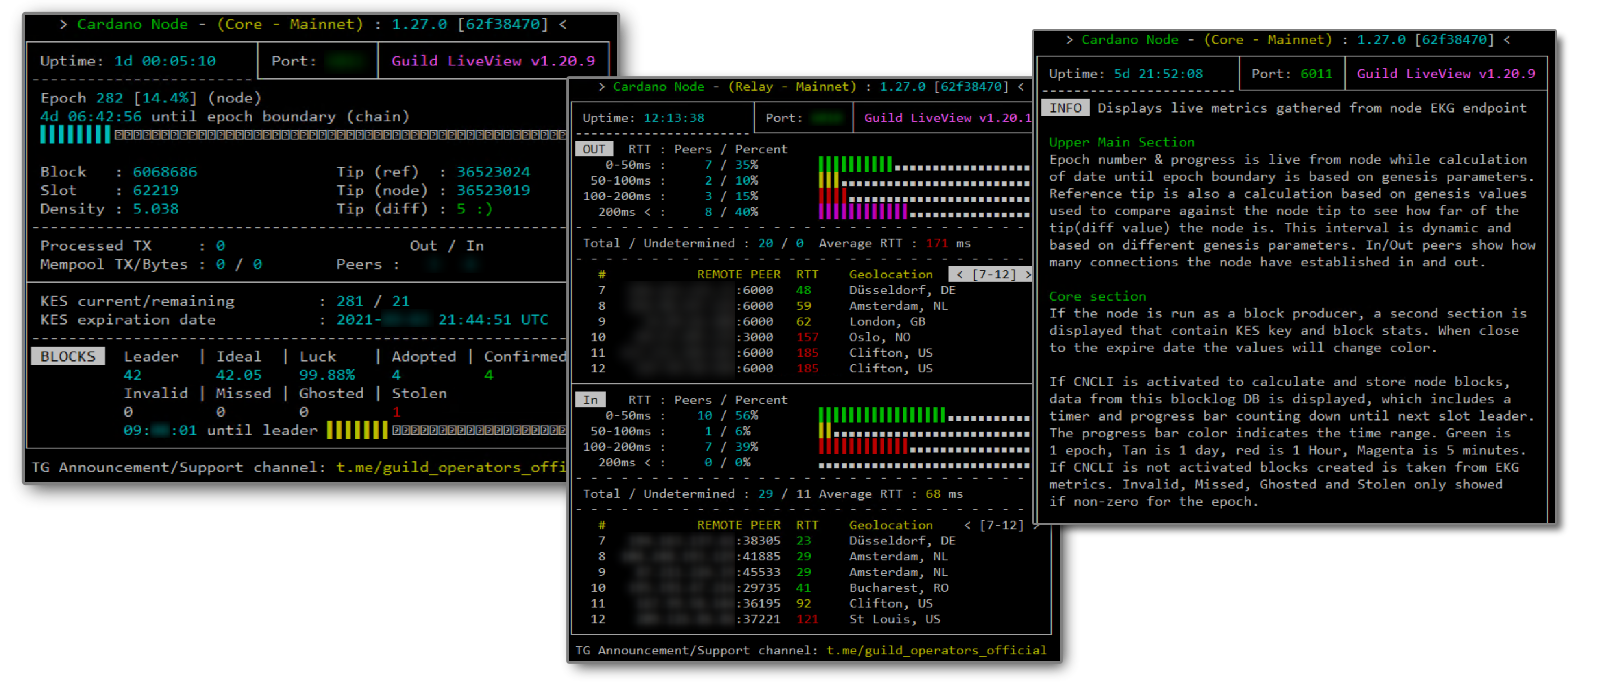
Real-time CLI monitoring — gLiveView
gLiveView is a bash script from the Guild Operators community that gives you a live terminal dashboard of your node's current state. It connects to the node's local metrics endpoint, detects whether the node is a relay or block producer, and adjusts its output accordingly.
gLiveView is good for:
- Quickly checking node health without leaving the command line
- Seeing live peer connection counts (hot/warm/cold)
- Watching block production in real time during an epoch
gLiveView does not provide:
- Alerting — there is no way to be notified when something goes wrong
- Historical data — you can only see the current moment
- Multi-node views — one terminal per node
For installation and configuration, see the Guild Operators gLiveView guide. gLiveView is part of the Guild Operators script suite and maintained by that community.
Full observability stack — Prometheus, Grafana, and Alertmanager
For production monitoring you need metrics persistence, dashboards, and alerting. The standard stack is:
- cardano-tracer — the node forwards traces to
cardano-tracerover a local socket; the tracer exposes a Prometheus scrape endpoint - Prometheus — scrapes and stores time-series metrics
- Grafana — dashboards and visualisation
- Alertmanager (optional but recommended) — routes alerts to email, PagerDuty, Slack, etc.
This stack persists locally observable metrics over time, lets you set alert thresholds (KES expiry window, peer count floor, disk usage ceiling), and gives you historical views to diagnose incidents after the fact.
See Prometheus and Grafana setup for the full guide. For a deep dive into tracing configuration — backends, namespaces, severity filters, and cardano-tracer options — see the New Tracing System reference.
Global Network Monitoring - openBlockPerf
In a global, decentralized environment like the Cardano blockchain, in addition to monitoring your own local resources, you can also measure and record what you see and receive from the rest of the network—that is, all other stake pools and relays.
When these views are consolidated into a joint database, they provide a unique insight into the dynamics, performance, and potential risks within the dynamic network managed by so many different operators.
openBlockPerf is a project that addresses precisely this aspect of monitoring. Any stake pool operator can participate using one or more of their relay nodes, allowing the tool to track the propagation times of all blocks generated by other pools. In return, the operator receives metrics showing how their own blocks were experienced by all other participants.
This data, collected over extended periods from various nodes and across protocol updates, is then useful for
- Research validation
- Engineering paths
- Operational monitoring
- Application design
- Governance decisions
Which to use
| gLiveView | Prometheus + Grafana | openBlockPerf | |
|---|---|---|---|
| Real-time node status | ✓ | ✓ | — |
| Historical data | — | ✓ | ✓ |
| Alerting | — | ✓ | — |
| Multi-node dashboards | — | ✓ | ✓ |
| No extra services required | ✓ | — | — |
| Works over SSH | ✓ | ✓ (with tunnel) | — |
| External perspectives | — | — | ✓ |
Most operators run both: gLiveView for quick manual checks when SSH'd into a node, and Prometheus/Grafana for persistent monitoring and alerting. openBlockperf is operated by some Operators since 2023 and open for any voluntary participation. Ideally on the stake pools relay nodes.